Drone Inspection vs Rope Access for Wind Turbines: The Real Cost Comparison
Most cost comparisons between drone inspection and rope access look at the wrong number. Here is the full picture: mobilisation, downtime, data quality, and what bad inspection data actually costs you downstream.

Katja Weissbach
Head of Sales

Table of contents
Share
Drone Inspection vs Rope Access for Wind Turbines: The Real Cost Comparison
You have a line item on your inspection budget. It says rope access costs X per turbine. Someone shows you a drone quote. It says Y per turbine. Y is lower. The case looks obvious.
It is not.
The cost comparison most operators run when evaluating inspection methods is missing the majority of the actual cost. It compares what you pay the inspection team. It does not compare what you pay downstream because of what the inspection team produces.
That downstream cost is where the real difference lives.
What the standard cost comparison leaves out
When an O&M manager compares rope access to drone inspection, the comparison usually has three inputs: inspection fee, mobilization, and downtime.
Those are real costs. They matter. But they are the visible fraction of the total.
The costs that do not appear in the comparison are:
The cost of decisions made on data that cannot be compared to previous inspections. The cost of warranty claims that cannot be supported because the inspection record does not meet evidential standard. The cost of repair campaigns planned against findings that cannot be trended because the flight path varied between visits. The cost of a turbine that gets an unnecessary repair because a resistance anomaly was flagged as a failure when it was not one.
None of these appear in the per-turbine inspection quote. All of them are real expenditure triggered by the quality of what the inspection produces.
A method that costs less per turbine and produces data that drives unnecessary repairs, misses defensible claims, and forces reactive maintenance decisions is not cheaper. It is more expensive and harder to see.
The rope access cost structure
Rope access inspection is the reference method. It has been the industry standard for decades. Its costs are well understood.
Mobilisation. A rope access campaign requires a trained team, specialist equipment, and logistics coordination. For a single site visit, mobilisation costs are fixed regardless of how many turbines are completed in a day. For small portfolios or single-turbine inspections, mobilisation cost per turbine is high. For large campaigns at a single site, it amortises more effectively.
Time at height. A rope access team descends to each blade individually to conduct inspection and measurement. For a complete visual inspection of a three-blade turbine — leading edge, trailing edge, pressure and suction side, root area — the time at height is substantial. For an LPS inspection added to the same visit, the technician must access each blade tip receptor separately. Multi-hour per-turbine durations are standard. Weather conditions directly affect what is achievable in a day.
Safety infrastructure. Working at heights of 100 metres and above requires harnesses, anchoring systems, fall arrest equipment, permit-to-work processes, and a safety observer on the ground. This is not optional cost. These are non-negotiable requirements for legal compliance. They add time and resource to every turbine visit.
Turbine downtime. Rope access inspection typically requires the turbine to be stopped and the rotor locked. Each hour of downtime during inspection is an hour of lost production. For a turbine with a capacity of 3 MW operating at a reasonable load factor, the production value of a multi-hour inspection stop is measurable. Multiply this across a fleet campaign and downtime cost becomes significant relative to the inspection fee itself.
Data processing. Rope access inspections produce images and manual notes. Processing this data into a structured report takes time and depends on the skill and consistency of whoever does it. Report formats vary between teams and visits. Comparison across years requires reconciliation effort that is rarely budgeted in the inspection fee.
Where drone inspection changes the economics
Autonomous drone inspection for wind turbines does not eliminate all of these costs. It changes which costs are fixed, which are variable, and which disappear entirely.
Mobilisation scales differently. An autonomous drone inspection platform does not require a rope access team to travel to each turbine. The equipment and operator deploy to the site. Within a campaign, the marginal cost of adding turbines is lower because the fixed mobilisation cost is shared differently. This matters most at fleet scale, where the number of site mobilisations is a significant driver of total campaign cost.
Time at height approaches zero. This is the structural change. With autonomous inspection, no technician descends to the blade. The operator supervises from the ground while the drone executes the pre-planned mission. The safety infrastructure required for working at height — harnesses, anchoring systems, fall arrest, observer — is not required in the same way.
Production loss changes in character. Autonomous inspection typically requires less turbine downtime than rope access for the visual inspection mission. The exact parameters depend on the turbine type, site conditions, and inspection scope. What changes structurally is that the platform is designed to minimise rotor stop time and execute efficiently within operational constraints.
Data quality is built into the method. This is the cost dimension that does not appear in any comparison until something goes wrong downstream.
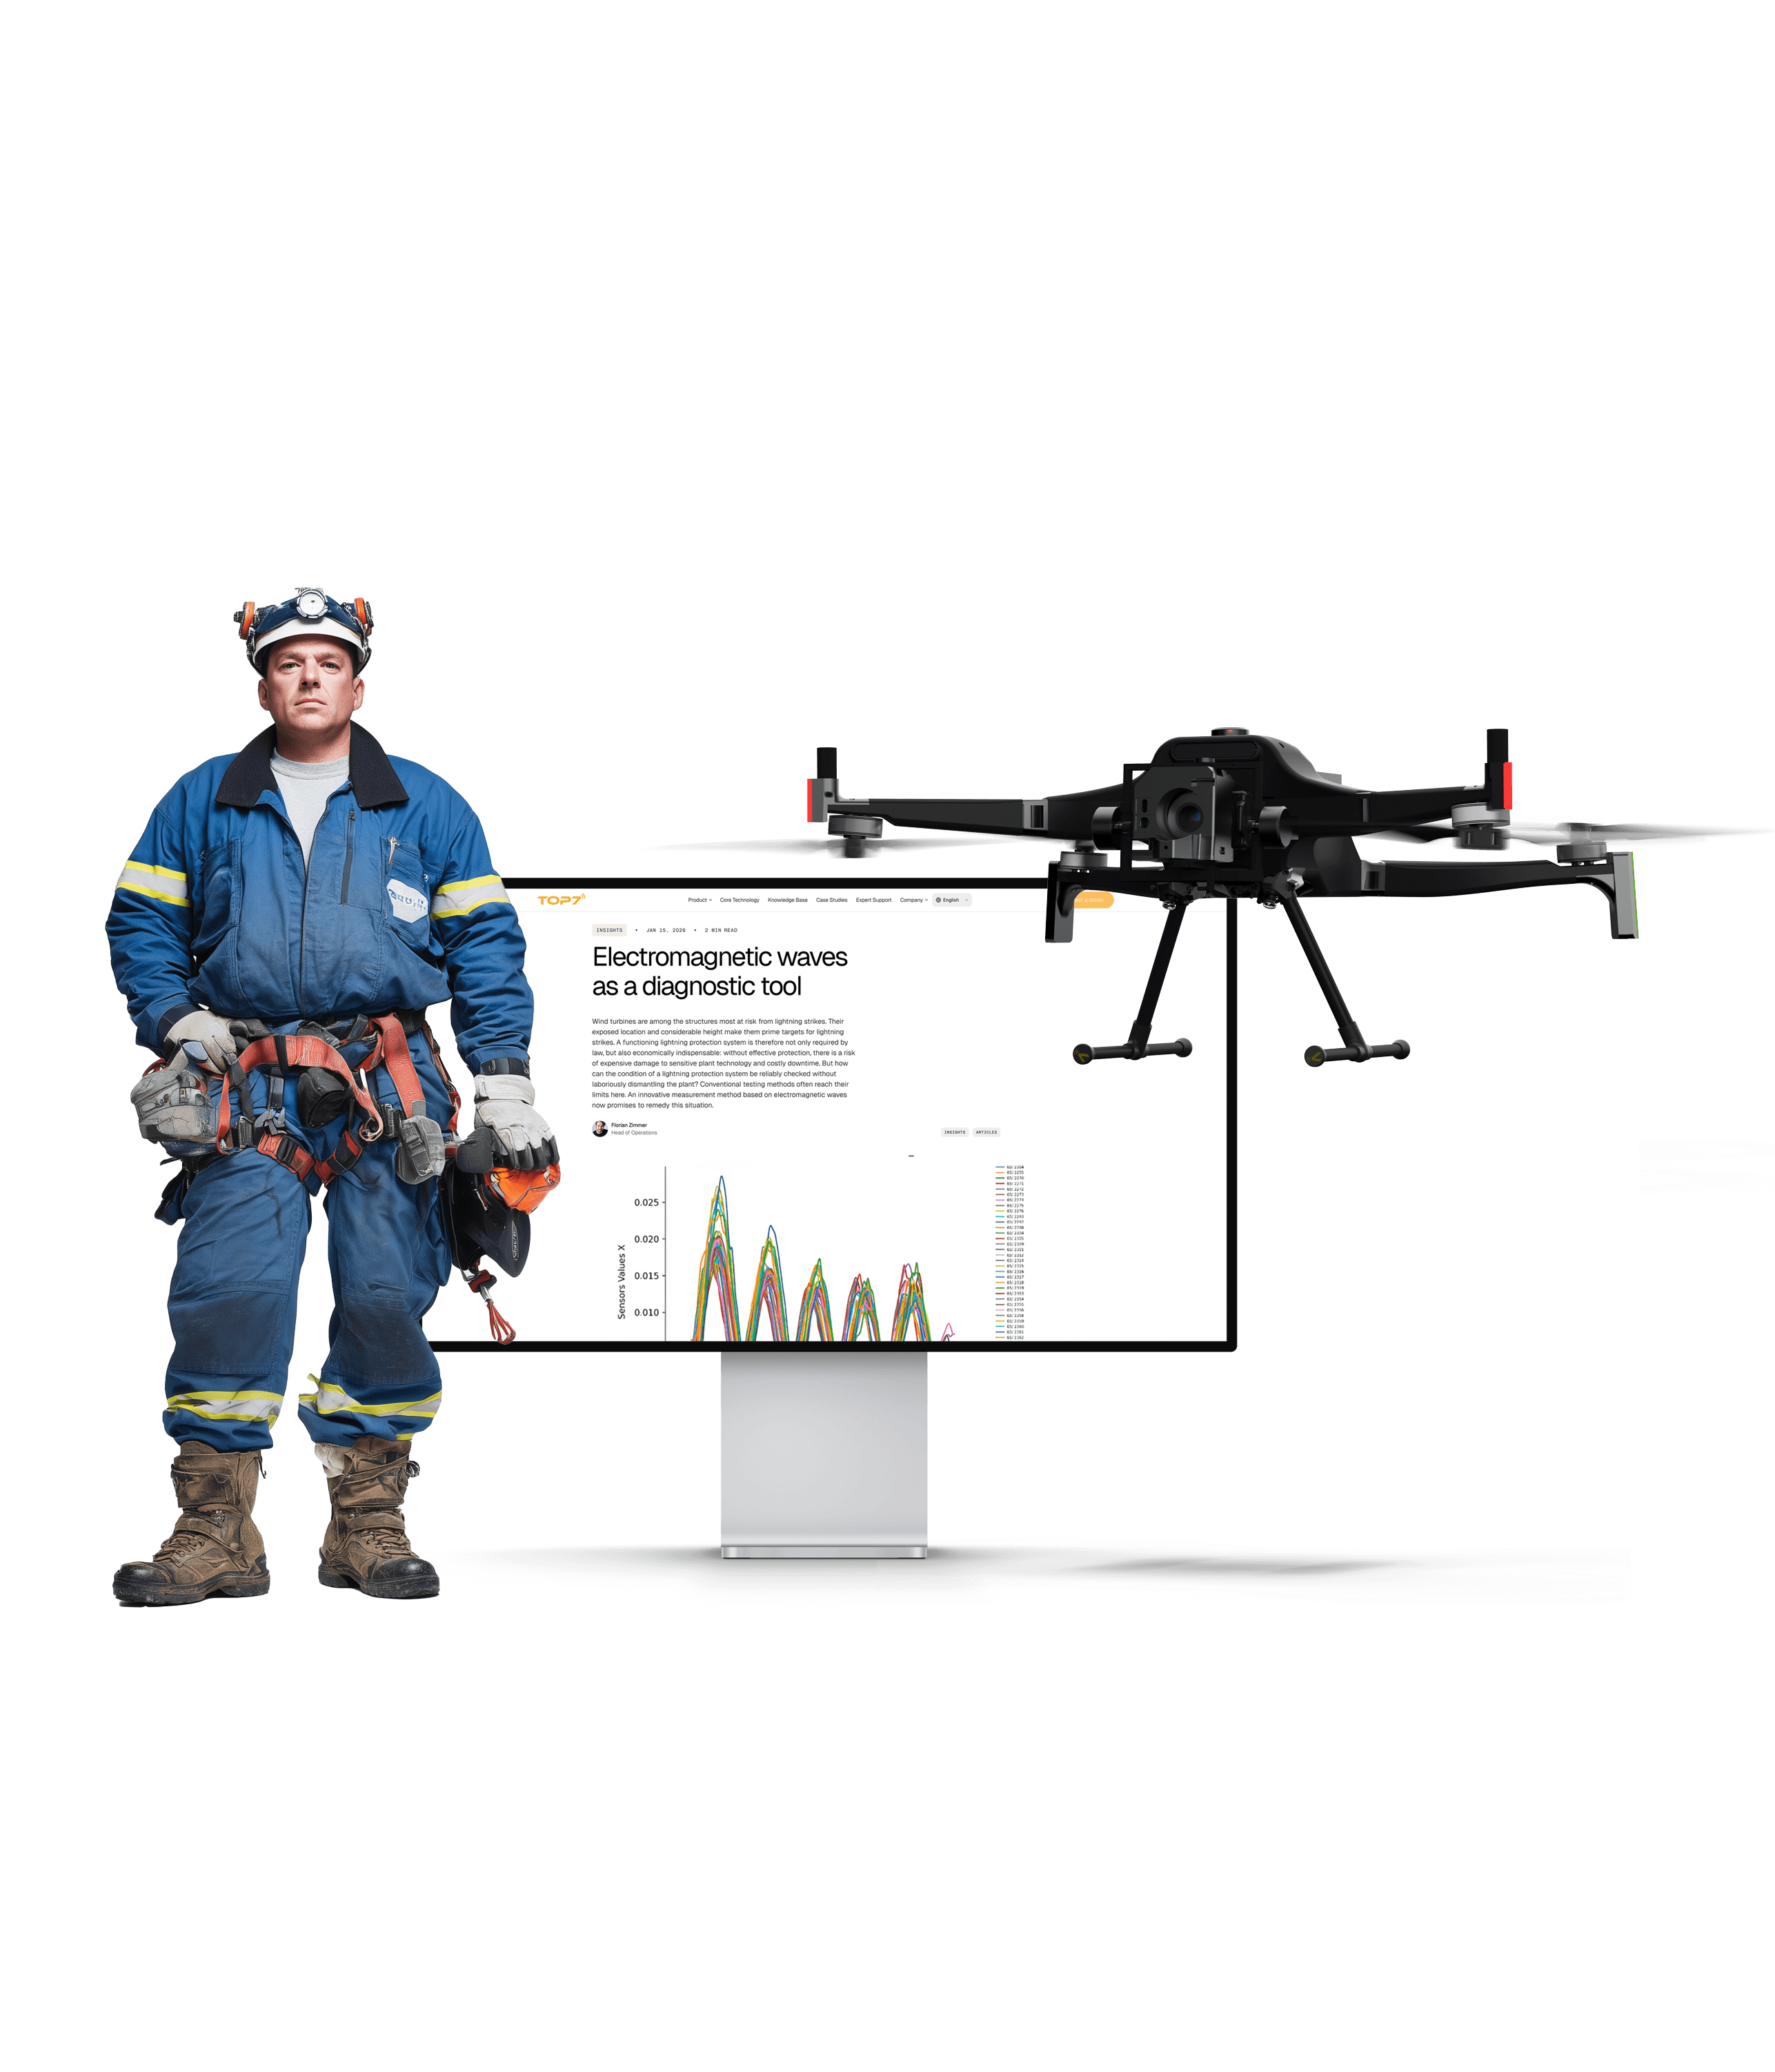
An autonomous inspection platform using SLAM navigation plans its flight path against the physical geometry of the specific turbine being inspected — using TOPseven's patented optical reference method (German patent DE 10 2020 210 618) to capture the exact tower coordinates, hub dimensions, blade geometry, and rotor parameters in a reference flight. The flight path is locked to that geometry. The same position is captured at the same distance and angle on every visit.
That repeatability is not a quality feature. It is a cost reduction measure. It is the difference between inspection data you can make decisions with and inspection data that requires guesswork to interpret.
Calculate your drone inspection ROI.
The data quality cost: what bad inspection data actually costs
This is the number that is never in the comparison. It is also the largest number.
Reactive maintenance cost. When inspection data cannot be trended reliably because the flight path varies between visits, maintenance is planned on current condition snapshots rather than progression evidence. A finding that appears serious in isolation may be stable and low-priority. A finding that looks minor may be progressing rapidly. Without repeatable data, you cannot tell the difference. You either repair more than necessary — which costs money — or defer repairs that should not be deferred — which costs more later.
Warranty claim exposure. As covered in detail in the end of warranty article, inspection data that is non-repeatable and non-traceable cannot support a warranty claim under scrutiny. The cost of a failed warranty claim is not the cost of the inspection. It is the full cost of the repair — blade replacement, crane mobilisation, production loss — that should have been the manufacturer's liability and became yours because your inspection data could not prove when the damage occurred.
Insurance and compliance risk. Insurers and regulators increasingly scrutinise inspection data quality. A programme that cannot demonstrate a consistent methodology, traceable outputs, and evidence of positional repeatability presents a risk profile that can affect coverage terms. This is a real cost that does not appear until it affects a renewal or a claim.
False positive repair triggers. For LPS inspection specifically, conventional resistance measurement produces false positives when surface corrosion or micro-cracks elevate the resistance reading without representing a genuine functional failure. Each false positive triggers an investigation, potentially a rope access visit to examine the blade, and sometimes a repair that was not necessary. The electromagnetic wave approach used by the BEAT sensor eliminates this category of cost by distinguishing genuine failures from resistive anomalies that do not affect system function.
The comparison that actually matters
The correct cost comparison is not inspection fee A versus inspection fee B.
It is: total cost of operating a turbine fleet with inspection method A versus total cost of operating a turbine fleet with inspection method B, over the asset lifetime.
That comparison includes inspection fees, mobilisation, downtime, data processing, maintenance decisions made from inspection data, warranty claims supported or lost, insurance costs, and the cumulative cost of reactive versus planned maintenance.
When the comparison is framed this way, the input that changes the output most is not the inspection fee. It is the quality and comparability of the data the inspection produces.
An inspection method that costs more per turbine visit but produces data that enables precise maintenance planning, supports defensible warranty claims, eliminates false positive repair triggers, and builds a continuously improving asset intelligence record delivers lower total cost of ownership than a method that costs less per visit and produces data that cannot be relied upon for any of those purposes.
This is not a theoretical argument. It is the calculation every operator eventually runs after their first warranty claim is disputed, their first unnecessary repair is completed, or their first attempt to plan a major repair campaign hits the wall of non-comparable historical data.
Planning an inspection programme around total cost
An inspection programme designed for total cost of ownership rather than unit inspection cost has different parameters.
It starts at commissioning, not at the first maintenance trigger. The baseline inspection — establishing the reference condition of every blade and the LPS signature for every turbine — is the most valuable inspection in the programme because every subsequent inspection is compared to it.
It uses a consistent method across every visit. Changing inspection providers or methods between years breaks comparability. Every year the method changes is a year the trend analysis cannot cross.
It treats LPS inspection and visual inspection as separate planned activities, both within the annual maintenance schedule, neither substituting for the other.
It stores data in a structure that supports comparison across years. The inspection report for this year needs to be directly adjacent to the inspection report from last year. Not in separate folders. Not in different formats. In a structure that makes comparison a function of the system, not a manual reconciliation task.
It plans campaigns at fleet scale to make mobilisation cost efficient. Grouping turbines approaching the same milestone — warranty expiry, periodic inspection interval, post-event response — into coordinated campaigns reduces the fixed cost per turbine and compresses the total campaign duration.
Calculate your drone inspection ROI.
The question to ask your inspection provider
Before comparing any two inspection quotes, ask one question of each provider.
Can you show me, from data you have already collected, how a finding at position X on blade Y in this year's inspection corresponds to a finding at position X on blade Y in last year's inspection?
If the answer is a demonstration — a side-by-side comparison at the same position with verifiable geometry — the data is repeatable and the comparison can be trusted.
If the answer is an explanation of why that is difficult, or a description of what they do instead, you have your answer about what the inspection actually produces.
The inspection fee is the cost of taking the inspection. The data quality is the cost of everything that happens afterward.
Is drone inspection cheaper than rope access for wind turbines? The answer depends on which costs you include in the comparison. On a pure inspection fee basis, autonomous drone inspection is typically competitive with or lower than rope access for comparable scope. When the comparison includes mobilisation efficiency at fleet scale, production loss during inspection, data processing time, and — most significantly — the downstream cost of decisions made from inspection data, the gap widens further in favour of well-executed autonomous inspection. The most expensive cost in any inspection programme is not the inspection fee. It is the cost of acting on data that cannot be reliably trended, compared, or used to support warranty claims.
What does rope access wind turbine inspection cost? Rope access inspection cost varies by market, team size, turbine type, and access conditions. The inspection fee is only one component. Mobilisation, equipment, safety infrastructure, turbine downtime during inspection, and data processing are additional cost categories that are sometimes quoted separately and sometimes absorbed into day rates. For a meaningful comparison with alternative methods, all cost categories need to be on the table, not just the inspection visit fee.
What is the total cost of wind turbine inspection? Total inspection cost includes the inspection fee, mobilisation and logistics, turbine production loss during inspection stops, data processing and report production, and the downstream costs that flow from inspection data quality: maintenance decisions made on non-comparable data, warranty claims that cannot be supported, false positive repair triggers, and the cumulative difference between reactive and planned maintenance over the asset lifetime. Inspection programmes optimised for unit cost often produce higher total asset management cost than programmes designed around data quality and repeatability from the start.
Why does inspection data quality affect inspection cost? Inspection data that cannot be compared reliably across visits forces maintenance planning based on current condition snapshots rather than progression trends. Without trend data, the difference between a stable finding and a progressing one is not visible until it becomes a failure or an unnecessary repair. Both outcomes cost more than the alternative. Data quality also determines whether findings can support warranty claims, whether LPS anomalies represent genuine failures or surface corrosion, and whether insurance and compliance assessments can be satisfied with the available record. All of these have direct cost implications that dwarf the difference in inspection fee between methods.
How does autonomous drone inspection reduce wind turbine inspection costs? Autonomous drone inspection reduces costs across several categories. No technicians work at height, which eliminates the safety infrastructure costs and time requirements associated with rope access. SLAM-based navigation produces repeatable flight paths that enable direct comparison of inspection data across visits, reducing the cost of maintenance decisions made from non-comparable data. Autonomous execution reduces operator dependency and produces consistent data quality independent of individual pilot skill. At fleet scale, mobilisation efficiency improves because the fixed cost of deploying the platform is shared across more turbines per campaign. The patented optical reference method means turbine-specific models can be generated quickly, reducing setup time for each site.
Looking for more? Dive into our other articles, updates, and strategies


Expert Robotics.
Expert Knowledge.
Operator insights, technical deep-dives, benchmark data, and platform updates from the field. No fluff.